Transport, infrastructure and building
Is Europe’s infrastructure resilient enough for future rainstorms?
August 29, 2021
Europe’s infrastructure is designed to withstand extreme rainfall conditions up to a certain level. Now that these conditions are changing, and the frequency of high rainfall intensities is increasing, the design criteria of the past need to be adjusted as well. A study for the entire European continent has been carried out to see how projected changes in extreme rainfall feed into design criteria for infrastructure.
Rainfall intensity and duration
The intensity of extreme precipitation in the area where you live, in mm’s rainfall per hour, is higher for shorter than for longer time intervals. When it rains, say, for 24 hours in a row, there will be a period of 1 hour when it rains hardest. Likewise, there will be a period of two hours when it rains a little less hard than that one-hour period, but harder than the average for the entire 24 hours period. And so on. In other words: when you plot rainfall intensity against the duration of rainfall, the curve in the graph will be a decrease of rainfall intensity with an increase of rainfall duration. This is a ‘rainfall intensity-duration’ curve.
Frequency of extreme events
You can draw-up such a curve for rainfall events that happen annually. Likewise, you can make these curves for rainfall events that happen once every two years, every ten years, or once in a hundred years. These curves will not be the same. Rainfall intensity during a certain time interval, say an hour, will be more extreme when the events you look at are rarer (and the frequency of occurrence is smaller). Maximum rainfall intensity for one hour will be higher for rainfall events that happen only once a decade compared with rainfall events that happen annually.
So, when you plot ‘rainfall intensity-duration’ curves for an annual event and a decadal event in the same graph, the curve for the decadal event will take a higher position in the graph, indicating higher rainfall intensities on the vertical axis for the range of rainfall durations on the horizontal axis. By including the effect of frequency of occurrence of rainfall events, we get ‘rainfall intensity-duration-frequency’ curves.
Extreme conditions for infrastructure design
We use these curves when designing our roads, railways, bridges, etc. These curves tell us what extreme rainfall conditions our infrastructure needs to withstand. If we want our infrastructure not to be destroyed under rainfall conditions that happen more often than once a century, we take the ‘rainfall intensity-duration’ curve for a return period of 100 years as a starting point for our design.
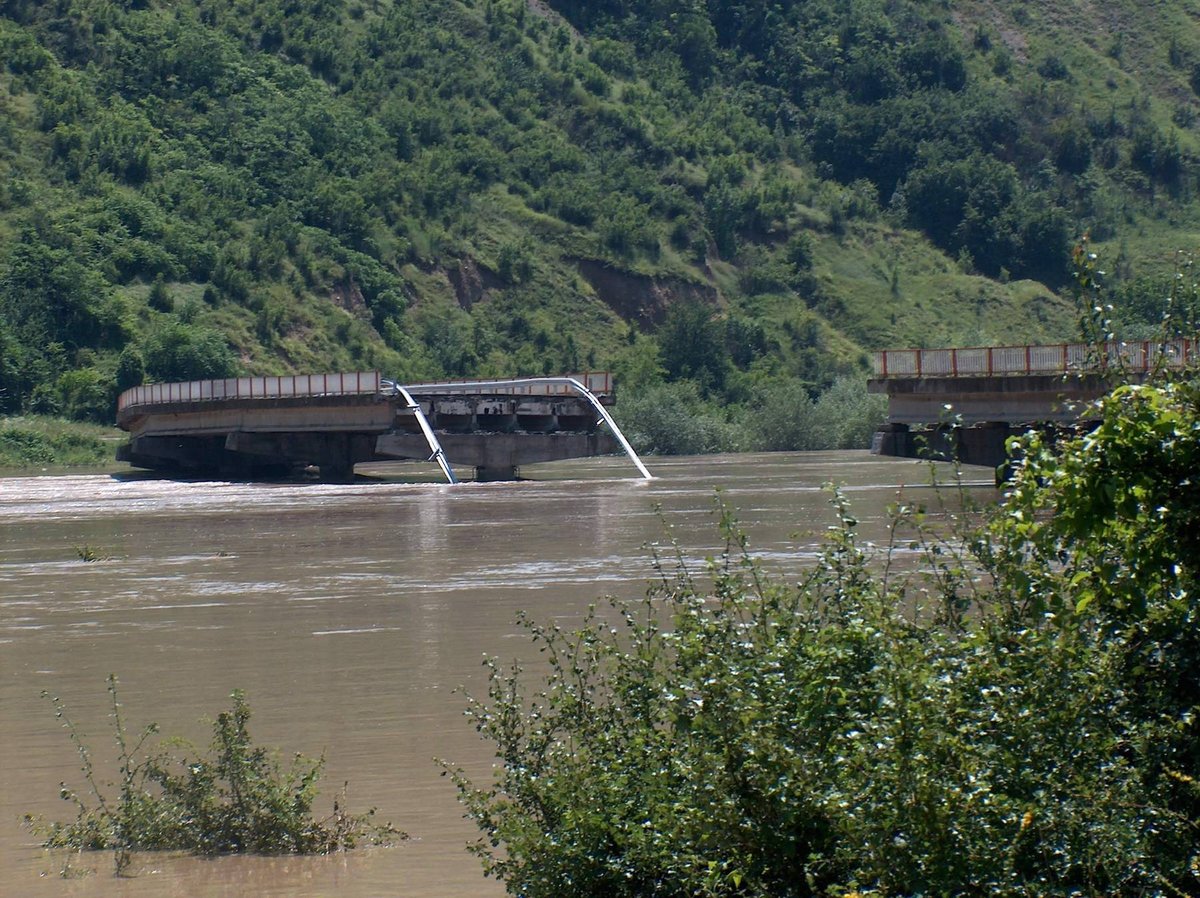
Rainfall intensity is increasing in Europe because of climate change. The ‘rainfall intensity-duration’ curve for a return period of 100 years is different now than it was 50 years ago, and it will continue to change in the future. This change calls into question the resilience of the existing infrastructure under more frequent and intense rainstorms in the future. The infrastructure has been designed for less extreme conditions than we have today. The risk of infrastructure breaking down will increase unless we adapt them to the more extreme rainstorms of the future.
Quantifying changing design curves
If we want to adapt our infrastructure to the more extreme rainstorms of the future, we need to know how these curves are changing. This has been studied for Europe as a whole. Curves have been quantified for rainstorms with different return periods ranging between 1 and 100 years. For each return period, rainfall intensity has been quantified for several rainfall durations: 0.5, 1, 3, 6, 12 and 24 hours. This has been done for the period 1971 - 2000, representing current conditions, and for two future time slices: 2041 - 2070 and 2071 - 2100. The curves for current conditions have been quantified from satellite data verified with ground-based observations. The curves for future time slices have been quantified from climate model projections for a moderate and high-end scenario of climate change.
Up to three times more likely
Extreme precipitation events will intensify this century. This intensification will be larger for rarer extreme events compared to less rare events. The intensification will also be larger for shorter duration events compared with large duration ones.
According to this study, sub-daily extreme precipitation intensities that now occur once every 50 or 100 years, will occur two to three times as often by the end of this century for a moderate and high-end scenario of climate change, respectively. So, return periods of extreme events will be much shorter.
The curve that shows rainfall intensity at different rainfall duration for, say, once-in-a-hundred years events will be different mid-century and even more so by 2100 compared with current conditions. These curves will also be more different for a high-end scenario of climate change compared with a moderate one.
Resilience infrastructure
The scientists state that these results call into question the resilience of the existing infrastructure under more frequent and intense rainstorms in the future. Proper adaptation strategies are needed to reduce the breakdown risk of infrastructure designed based on historical rainstorms, and create resilient societies, they conclude.
Source: Hosseinzadehtalaei et al., 2020. Journal of Hydrology 590, 125249.