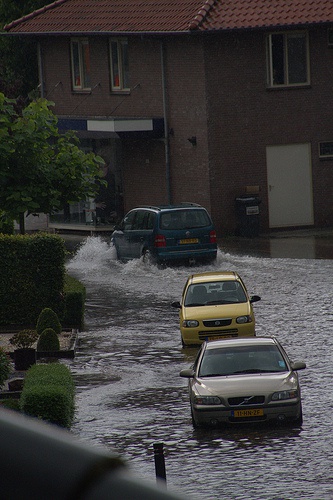
Precipitation increase in the Netherlands in the past century

Changes in the annual precipitation amounts, the precipitation amounts in the winter and summer halves of the year, the number of days per year with a precipitation amount greater than 20 or 30 mm, and the 5-d annual maximum precipitation amount were determined both for the period 1951–2009 using the data from 240 stations and the period 1910–2009 with the data from 102 stations. Significant increases were found for all six indices.
For the period 1910-2009 the following significant changes in precipitation amounts and intensity were found:
- 25% increase in mean annual precipitation;
- 35% increase in mean winter precipitation;
- 16% increase in mean summer precipitation, with a relatively strong increase since the beginning of the 1980s;
- almost doubling of the average number of exceedances of the 30 mm threshold. Most of these exceedances occur during the summer half-year, in particular a relatively strong increase after 1980;
- a sharp contrast was found between coastal regions with a significant increase in mean summer precipitation and the east and southeast of the country with little change in mean summer precipitation.
The increase in mean winter precipitation over the period 1951–2009 is partly explained by changes in the pattern of atmospheric circulation in this period which brings more humid maritime air over the Netherlands. The increase in mean summer precipitation is much more a local trend, which is probably related to changes in the sea surface temperature. An increase in the mean sea surface temperature during summer of 1.2–1.5°C was found during the period 1951–2006, being about twice as large as the global mean temperature change.
Source: Buishand et al., 2013. International Journal of Climatology 33: 815–833.
Photo: D. van Zuijlekom (www.flickr.com)


